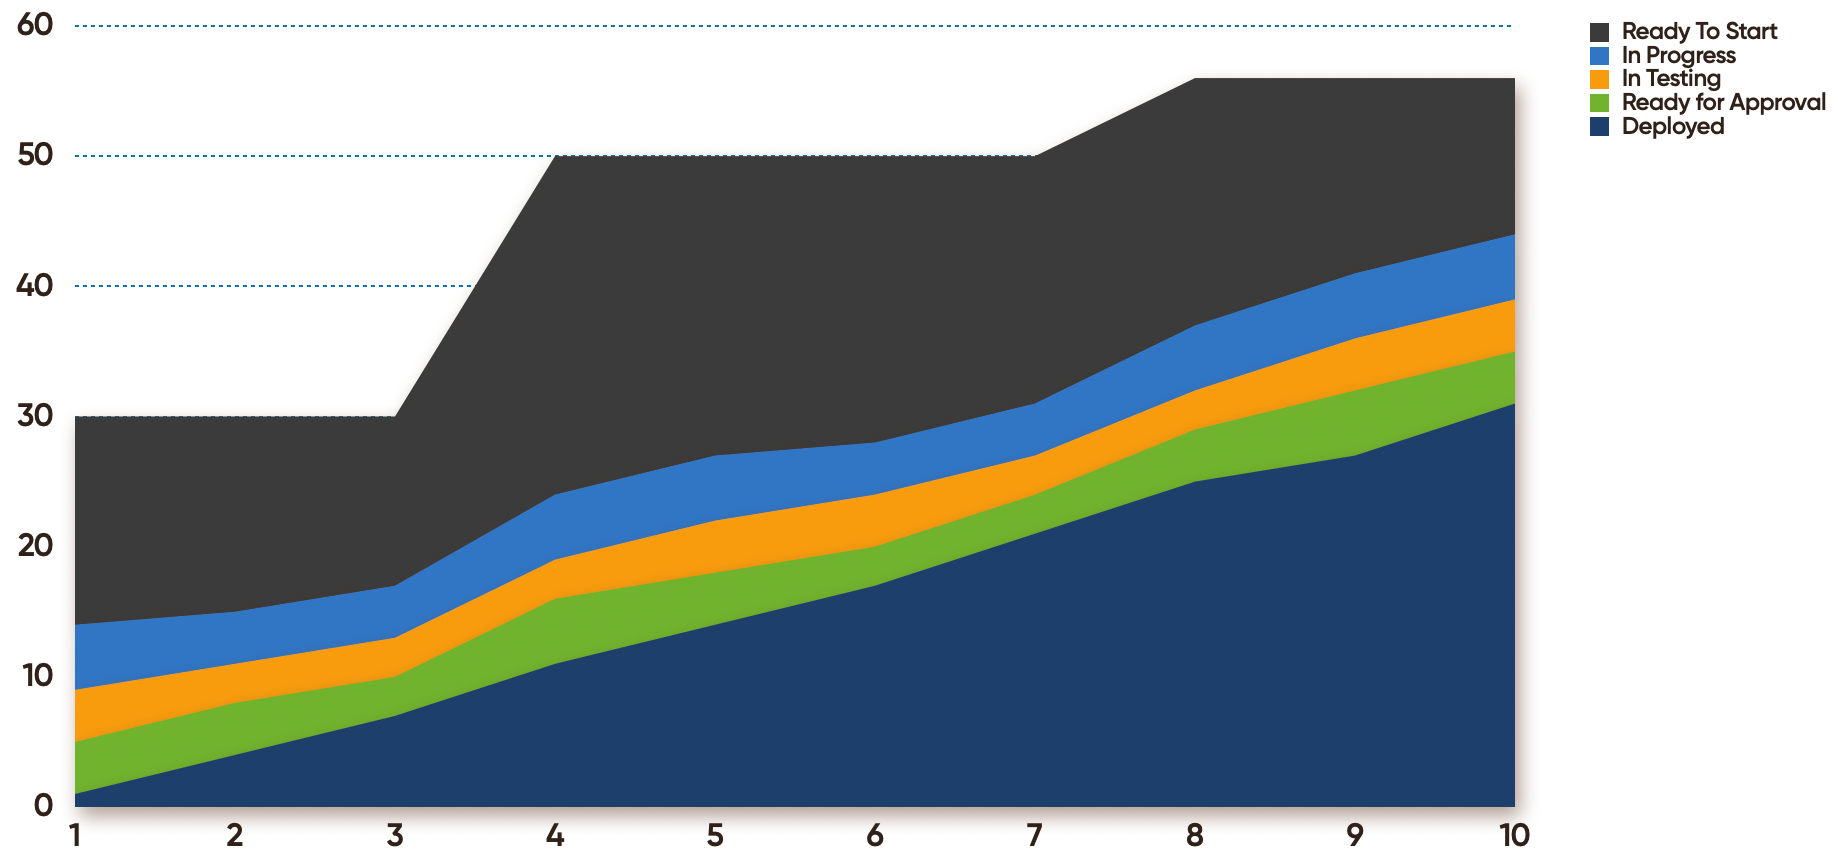
When we talk about making the work visible, there are two key aspects - what is the work and how is the work progressing. In this article, we are going to focus on how the work is progressing. Specifically, we are going to look at Cumulative Flow Diagrams as a means of visualizing work progress.
Opportunity Solution Trees
In this article, I want to go more in depth on Opportunity Solution Trees; what they are, how they are used, how to create one, and how I think about them slightly differently (but only slightly) than folks like Teresa Torres who really introduced them broadly to the Product community in her book “Continuous Discovery Habits”. This book, by the way, is a must have for anyone who works in software product development - not just folks in product-specific roles.
Make the work visible
A lot of teams have a backlog of some sort and some form of Kanban board — whether it is Jira, Trello, Monday, Asana, MS Project, or a bunch of post-its on a wall. These are all ways of making the work visible. But they aren’t enough.
There are two key aspects to making the work visible; what is the work and how is the work progressing.
The Behaviors
Over the past several years, as I’ve been helping teams and organizations improve their ability to deliver software products that are desirable, viable, and feasible, I have been experimenting with a Behavior Framework that has proven to be rather effective. And I’d like to share it with you in hopes that you find it useful and that you provide me feedback on your experiences with it.
Beginning a New Book
My plan is to write a series of blog posts all related to the behaviors framework. Some of them will be about a specific behavior. Some of them will be about tools or techniques that help teams express one or more of the behaviors. Some of them will be my own experiences. And some will be damn near complete fiction.


